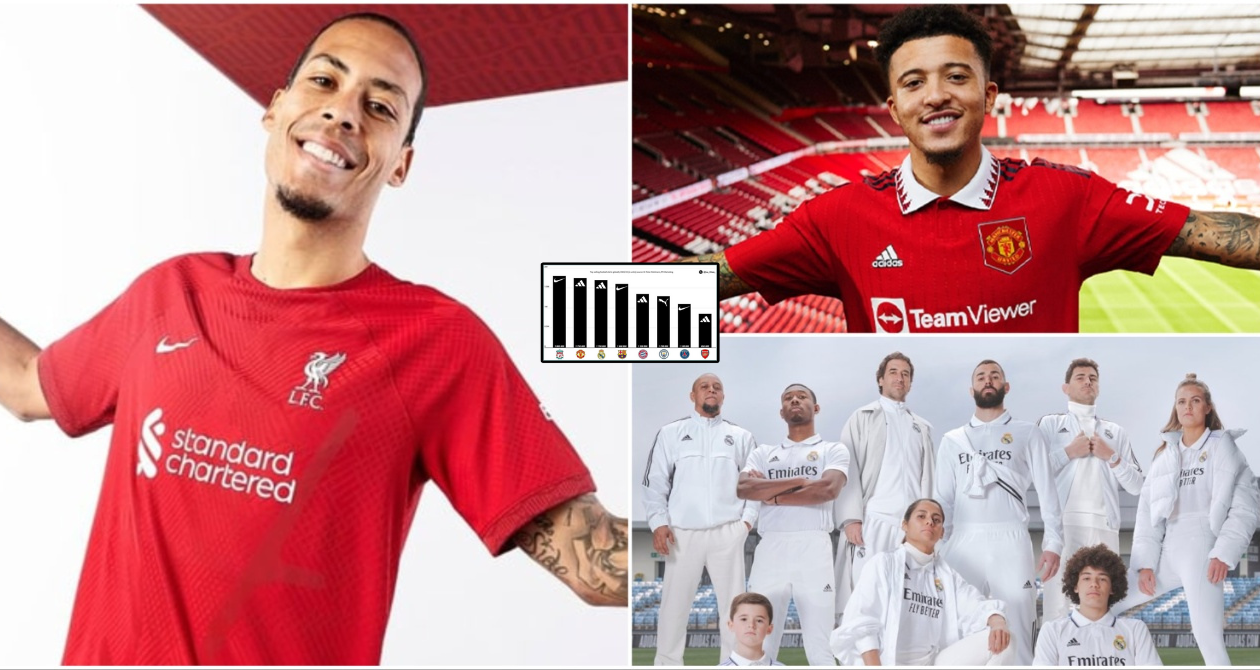
I'm not sure where else to put this but after talkSport's 'Celtic are bigger than City' nonsense topic. I've been reading all sorts of arguments to try and do City down and support the claim.
Stuff like: "Celtic have twice the number of supporters clubs as City do." That is easy enough to deal with since although it's correct: 800 is twice the official 400 City states on their site. It doesn't tell you much about the current fanbase size globally, it can be quite a misleading stat in truth. Especially since United and Liverpool state 300 and Arsenal 179 globally on their official sites...
I've been telling Arsenal fans the shirt sales data shows City outsold Arsenal in shirt sales for 2022/23(how annoying have they got, now they're relevant again?).
That is according to research by German industry expert Dr. Peter Rohlmann from PR Marketing, which includes unit sales:
Chelsea do NOT make the list after selling 800,000 replica shirts last season

www.givemesport.com
According to research by German industry expert Dr.

www.footyheadlines.com
I noticed people trying to discredit that on talkSports comments. Based off UEFA's
'The European Club Finance and Investment Landscape' report for the financial year of 2023(must have missed this). This prompted a number of publications to show Spurs 1 place above City(who were not in the top 10). Looking into the actual data analysis and explanations they provided though, it makes very little sense to me:
View attachment 115826
Firstly, what it says it's showing in the introduction, is kit deal revenue combined with the total merchandise revenue, for a calendar year and it's in Euros.
The first thing I noticed is, it does show City(€67m) outdid Arsenal(€65m) in 2022(in grey). However, it shows Spurs above City, which doesn't seem right since we know the value of the
kit deal revenues of each PL club:
| Club | Kit supplier | Value per year | Duration |
| Man United | Adidas | £90m (€104.8m) | 2015-2035 (extension) |
| Man City | Puma | £65m (€75.7m) | 2019-2029 |
| Liverpool | Nike | £60m (€69.9m) | 2020-2026 |
| Chelsea | Nike | £60m (€69.9m) | 2017-2032 |
| Arsenal | Adidas | £60m (€69.9m) | 2019-2024 |
| Tottenham | Nike | £30m (€34.9m) | 2018-2033 |
Things get more confusing still for me, reading the small print at the bottom:
So besides conflating different financial years for certain clubs without it being clear in their chart. Doesn't that mean, according to their analysis; Spurs and Chelsea beat Arsenal and City in 2022 by a clear margin, with Arsenal coming last in the Big 6? Arsenal's first title race in years. City after signing Haaland and going for treble. Both fanbases buzzing with excitement early on in the season. Chelsea and Spurs being awful, fans unhappy, both finishing outside of European places completely.
Also, if Spurs' starting point is around €35, to get to €74 is a much larger jump(they more than doubled it) than any of the other Big 6 clubs could manage. Are Spurs selling Levy gold coins in their club shop? What explains this discrepancy?
Lastly, to point out the obvious, €67m and €73m are both lower that the €75.7m per season City receive from Puma. I realise it's a CFG deal but even still, the vast majority will go to City's revenue, especially since NYCFC's shirts are made by Adidas. It's supposed to be the kit deal plus merchandise revenue figure also... To, in their words:
"provide probably as good a measure of club popularity as any". Are City selling merchandise at a loss in their club shop, for the combined total to be lower?
Have I missed something?
Or
Is this whole particular kit and mechandise analysis as misleading as it is confusing? I wouldn't mind but it's published by UEFA, yet it's the sort of thing a Liverpool fan from twitter would come up with, to raise more questions over City's revenues. I hope someone at City at least quizzed them on that and questioned the validity.


