Climate Change is here and man made

You've missed two fundamental points to the whole climate change debate:

Yes, extreme events have always happened, floods, storms, heat-waves, etc. But the frequency is increasing, and the likelihood of an extreme weather event is becoming higher. So one event on its own does indeed mean nothing, but an accumulation of events is a far more important statistic and points to an underlying change in climate.

And yes, climate has changed in the past, but at far, far lower rates. The rate of change in global temperatures we are currently going through cannot be simply explained by "natural" phenomena (when there have been rapid temperature changes in prehistory, these can usually be explained by some significant event). But what we do learn from the previous big changes in climate is that it is pretty catastrophic, and usually leads to mass extinctions. This is explained better in this video:

 
Just to illustrate the first point about extreme weather events, here is a chart that shows the ratio of the "record highs" and the "record lows" recorded across the USA, by decade. It shows a substantial increase in the number of times a new high temperature is recorded, in comparison to the number of times a new low temperature is recorded, which increases decade by decade. One possible conclusion from this is that extreme high temperatures were almost twice as likely to be recorded in the 2000s than in the 1950s.

temps_2.jpg
Not sure how a "record" high temp is an extreme!
Anyway Ill see your bar graph for north America and raise you Global Cyclones:
global_running_ace.png
 
The stupid thing with the media at the moment is they class a bit of rain as an extreme event, it is only extreme by the measure that people have had their houses flooded, it is actually a very unextreme event, extreme would be something like 25'C recorded in January or a hurricane of the likes we have never seen before. What happened in Cumbria isn't great but then the only areas that flooded were those most vulnerable to it, big surprise. I've seen a lot of chatter this week about climate change being responsible for what has happened and it is all chimed in as though we have never seen a flood before in the entirety of human history. I would love to hear a real definition of extreme in the weather context.

Yes the rainfall broke all records but we have only been recording this data for probably 100 years so of course it is bound to break records eventually simply because a record must always exist for something you measure. It's like recording temperature over many year's and year on year it is 30'C, the next year is recorded as 31'C, should that be classed as extreme?

I wish they would realize that climate change is normal, the Earth has undergone ice ages, fire ages and like now relatively flat ages. It hasn't not rained for the last several billion years and only this week has it flooded in Cumbria, climate change being directly responsible for a bit of extra rain is complete rubbish, someone will tell me it is also responsible for the relatively decent summer we have had too.

There is not much point in worrying about climate change because it is inevitable that at some point it will change in some way again. All it takes in fact is a world event such as a large volcano going off and that obliterates all records on CO2 and so on by itself.

I actually don't see myself as a denier but I don't think we can do anything about it for the most part and nor should we when there are far more pressing issues to be worrying about and expending resources on.
With the addition of an almost wilful desire to ignore population growth, this is exactly my stance.
 
The is no point talking to you, you're as thick as Donald Trump and just out to WUM.

If you want a proper conversation on the affects of global warming such as the dramatic changes in weather conditions then lets have one.

Otherwise I'm not falling for the bait this time.
It's not bait you fucking idiot.

Answer my question or point me out a year where no flooding occurred in any part of the country.

If not, jog on and stop quoting me you wasted blow blow job.

To say that just because parts of Cumbria flooded last week is definitive proof of anthropoligical climate change is the most moronic thing you've managed on here. Which is some doing.
 
With the addition of an almost wilful desire to ignore population growth, this is exactly my stance.

yep me too

these things work in massive cycles and we are still coming out of the last ice age is all

being Mancunian I I can't get too excited about rain however heavy it might be

especially when it's flood plains in flooding shocker
 
It's not bait you fucking idiot.

Answer my question or point me out a year where no flooding occurred in any part of the country.

If not, jog on and stop quoting me you wasted blow blow job.

To say that just because parts of Cumbria flooded last week is definitive proof of anthropoligical climate change is the most moronic thing you've managed on here. Which is some doing.
Oy, you owe for a thread bump......not even a fucking thank you.
 
This makes no sense. I make a comment that the data only shows surface temperature...

Let's look at your quote:

The most important aspect of this is that all the data sets are surface temperature, which accounts for a very tiny proportion of the planet's heat sink. Even then, the article shows that the same data could be interpreted in many different ways...

If you look at the graphs contained in the article you're refering to -http://judithcurry.com/2015/11/06/hiatus-controversy-show-me-the-data/ - they contain data for NASA GISS data, which is derived from surface stations combined with satellite data for SSTs.

So, yes, you're comment "that the data only shows surface temperature" was wrong.

and you say "no they don't, they show land surface temperature and sea surface temperature"

Wrong again. I did no such thing. My actual quote:

No they aren't. NASA GISS data is derived from surface stations combined with satellite data for SSTs.

As to your question about climate change deniers, well you tell me what you deny! Those that I have debated with in the past differ in what they deny; some deny there is any climate change, some deny that climate change is not due to human activities. So I guess you have a different viewpoint on this, so please enlighten me. Another nice graphic to illustrate this:

Escalator_2012_500.gif

Oh, dear. "nice graph"? I suppose it's "nice" if you like bogus bullshit.

The funny thing about that graph is that a graph showing the exact opposite can be constructed, depending on the time frame. Just as ‘figures don’t lie, but liars figure’, bogus charts like that can be contructed. What is amazing is the number of credulous, unthinking people that bogus chart has fooled.

1236215034.png


Each of the steps in their escalator clearly shows a short-term trend that’s flat or cools slightly. SkepticalScience misrepresented the trend of the “fourth step”. The time period they selected is November 1994 to December 2000. As it turns out, the only dataset that shows a flat trend during that period is the GISS Land-Ocean Temperature Index. Both HADCRUT4 and NCDC have significant warming trends from November 1994 to December 2000 at about 0.08 to 0.09 deg C per decade. The average of the three datasets is approximately 0.06 deg C/decade, and that is a significant warming trend.

1080246490.png

Actual Linear Trends During Fourth Step of Escalator

How significant is that 0.06 deg C per decade trend? It’s comparable to the trend in global surface temperatures since 1880!

What “The Escalator” would look like if SkepticalScience had used the real linear trend for the fourth step:

1779692917.gif


If you are going to use gifs in order to belittle 'skeptics', at least use ones that are not based on false, innacurate data.
 
Let's look at your quote:


If you look at the graphs contained in the article you're refering to -http://judithcurry.com/2015/11/06/hiatus-controversy-show-me-the-data/ - they contain data for NASA GISS data, which is derived from surface stations combined with satellite data for SSTs.

So, yes, you're comment "that the data only shows surface temperature" was wrong.


Wrong again. I did no such thing. My actual quote:


Ah, Skepticalscience's “The Escalator” gif animation. Oh, dear. The funny thing about that graph is that a graph showing the exact opposite can be constructed, depending on the time frame. Just as ‘figures don’t lie, but liars figure’, bogus charts like that can be contructed. What is amazing is the number of credulous, unthinking people that bogus chart has fooled.

1236215034.png


Each of the steps in their escalator clearly shows a short-term trend that’s flat or cools slightly. SkepticalScience misrepresented the trend of the “fourth step”. The time period they selected is November 1994 to December 2000. As it turns out, the only dataset that shows a flat trend during that period is the GISS Land-Ocean Temperature Index. Both HADCRUT4 and NCDC have significant warming trends from November 1994 to December 2000 at about 0.08 to 0.09 deg C per decade. The average of the three datasets is approximately 0.06 deg C/decade, and that is a significant warming trend.

1080246490.png

Actual Linear Trends During Fourth Step of Escalator

How significant is that 0.06 deg C per decade trend? It’s comparable to the trend in global surface temperatures since 1880!

What “The Escalator” would look like if SkepticalScience had used the real linear trend for the fourth step:

1779692917.gif


If you are going to use gifs in order to belittle 'skeptics', at least use ones that are not based on false, innacurate data.

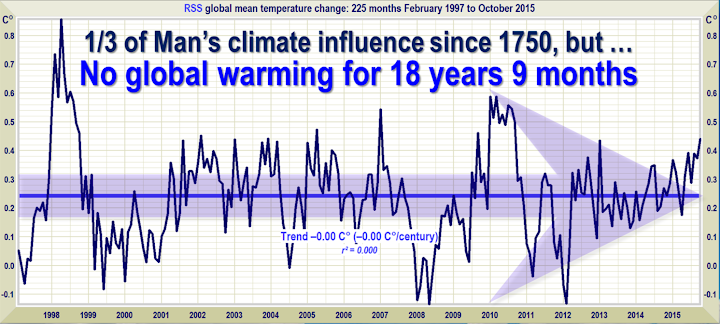
the last ice age that we are still emerging from started a bit before 1970 tbf
 

Don't have an account? Register now and see fewer ads!

SIGN UP
Back
Top
  AdBlock Detected
Bluemoon relies on advertising to pay our hosting fees. Please support the site by disabling your ad blocking software to help keep the forum sustainable. Thanks.