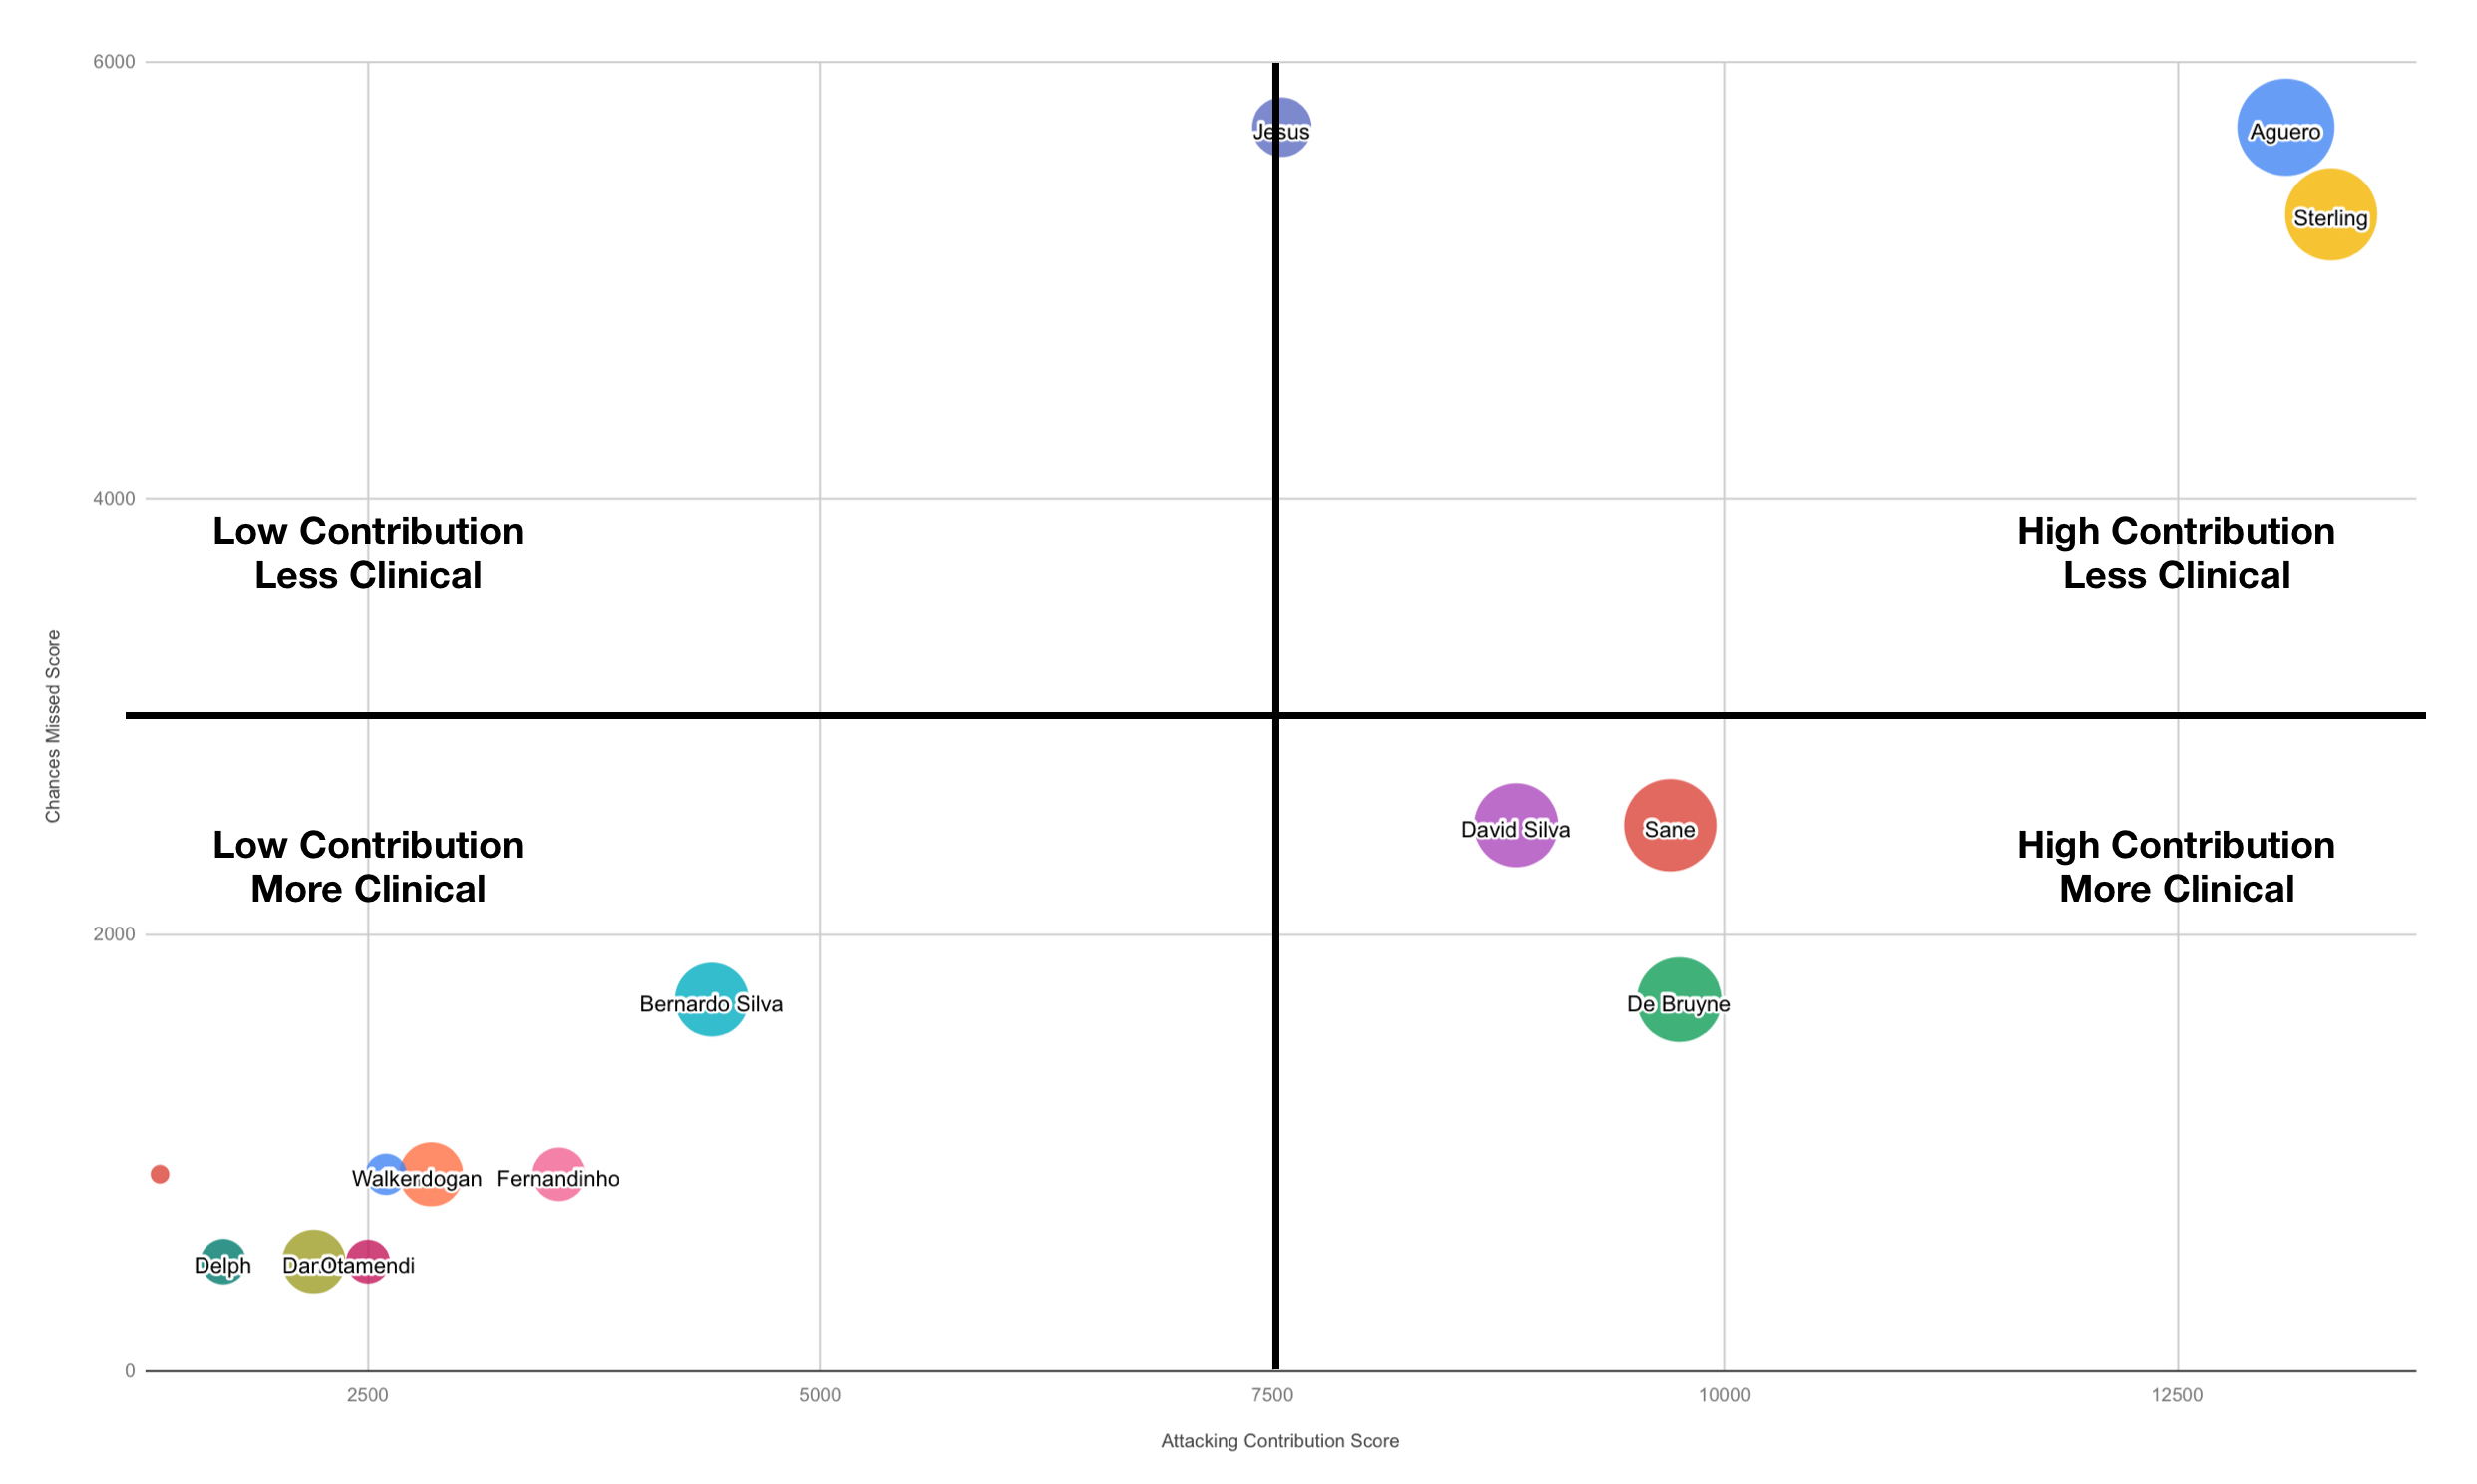
Attacking Influence Assessment - City Players
This is a preliminary (work-in-progress) bubble chart mapping players to four basic quadrants representing attacking influence. It is based on a scoring system I am developing in an attempt to create my own baseline method of assessing player influence on attacking play in the league over the course of the season (I may use it for predictive analysis for several buy-in draft Fantasy Football leagues next year). This is based on the official Premier League statistics (
https://www.premierleague.com/stats/top/players/goals?se=79) and my own formula for weighting contributions (goals and assists) and (big) missed chances, factoring in minutes played (to recognise relative opportunity to contribute). The higher the Attacking Contribution Score, the more the player contributed to our attacking play. The higher the Chances Missed Score, the less clinical the player’s finishing. The larger the player ‘bubble’, the larger their net influence on attacking play. This is meant to help assess variance in overall contribution to attack and identify consistency and potential for improvement (and thus, players that may be ‘major influencers’ next year based on other factors, such as additional playing time, changes to team role, or further development).
This version only includes City players who have played at least 500 minutes and have contributed at least one goal or assist. The ‘ideal’ quadrant for player position is the bottom-right quadrant, for obvious reasons. The unnamed player on the graph is Vinny(due to total net influence being so small), which is not surprising.
There are much better, much more detailed overall assessment systems out there, of course, but most are behind a paywall and I enjoy creating these sorts of assessment systems (and want to have a project to fill the void left by the Summer football break, not counting the World Cup, of course). I am still working through the scoring formula to make it more accurate/representative, and plan to create similar charts for previous seasons for year-over-year comparisons, but I thought this initial effort was worth sharing for discussion. I may eventually expand out to Opta or WhoScored stats for more granular performance analysis. I am posting this chart to a few player threads for reference—not sure it deserves its own thread.
It’s worth keeping in my that this does not reflect the overall contribution of the player (attacking and defensive play, nor intangible influence). I am thinking about how that could be quantitatively (and comprehensively) assessed and, if I am able to put something together, I think we would find Kevin, David, and Fernandinho would be up with Sterling and Aguero for overall contribution.
Sterling related observations:
1) Raheem is one of our most influential attacking players (Titanic, Hindenburg, etc.).
2) Based on my scoring system, even a small improvement in chance conversion would not only “stretch” the relative assessment range (by increasing the highest Attacking Contribution Score for the assessment universe), but take him much closer to the bottom-right quadrant, leading to substantially higher influence our attacking play.
3) Raheem still has huge potential to realise, as he could conceivably create fewer chances overall, but still contribute more to attacking play by being more clinical. As many of us have said, if he was to maintain or increase his chance creation AND improve his conversion rate, he could be undeniably one of the best players in the world (the stats would backup the claim beyond just ‘eye test’ evidence, as they do for Messi, Ronaldo, and Neymar).
Personally, my take away here is that he has not peaked yet.