Healdplace
Well-Known Member
- Joined
- 12 May 2013
- Messages
- 15,985
By the way - today is the one year anniversary of the last day not one single person died in the UK from Covid.
The Times has a story today (behind pay wall) that every case of a sports professional in a study of football, rugby NFL and others - where players have tested positive - ALL have been traced to a contact indoors. None from playing or training outside.
Were winning the war90 England hospital deaths by region:
30 Midlands, 23 NE & Yorks, 17 South East, 7 North West, 6 London, 5 East, 2 South West
Mid Yorkshire 10 - most by one trust.
In NW Chester 3, and 1 each in Blackpool, Liverpool, Manchester and Salford.
So the bame community in this country who are at higher risk of illness and death from covid don't want the vaccine. No problem, up to you.
I'm looking forward to the day when we have to scroll to page 48 of the off topic forum to find this thread, hope it's in my lifetime.
LolI agree with the sentiment but I'd suggest using the search function rather than scrolling through all those pages.


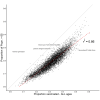
I don't know what is happening in Tidenham, though as a wild guess the good folk of Gloucestershire aren't willing to enter Wales for a jab in Chepstow, or else they ARE getting jabbed in Wales and the figures aren't being recorded properly. Border issues account for 99% of all known statistical oddities !Fairly benign (and obvious?) chart for a Sunday;
For every MSOA in England (~6,700): The % of people with at least 1 vaccination jab (x axis) vs the % of people in that MSOA over 65.
AS you'd expect, it shows that as you have an area with a higher proportion of older people, you have more of the total population vaccinated.
I don't know what is happening in Tidenham in the Forest of Dean, barely anybody vaccinated while Saxmundham have one of the highest vaccination rates but their proportion of over 65s isnt in the highest bracket.
How bad can the reporting be when they tell you there’s a delay in the number?
