More to the point, with all these closed borders, will there be much chance of the CL restarting ? It's fine to play internally, but I can see the CL being suspended again, or going to a neutral country over a couple of weeks, I can't see governments allowing even "elite" sport to travel between nations, they're already discussing a neutral venue for one of the europa league games.
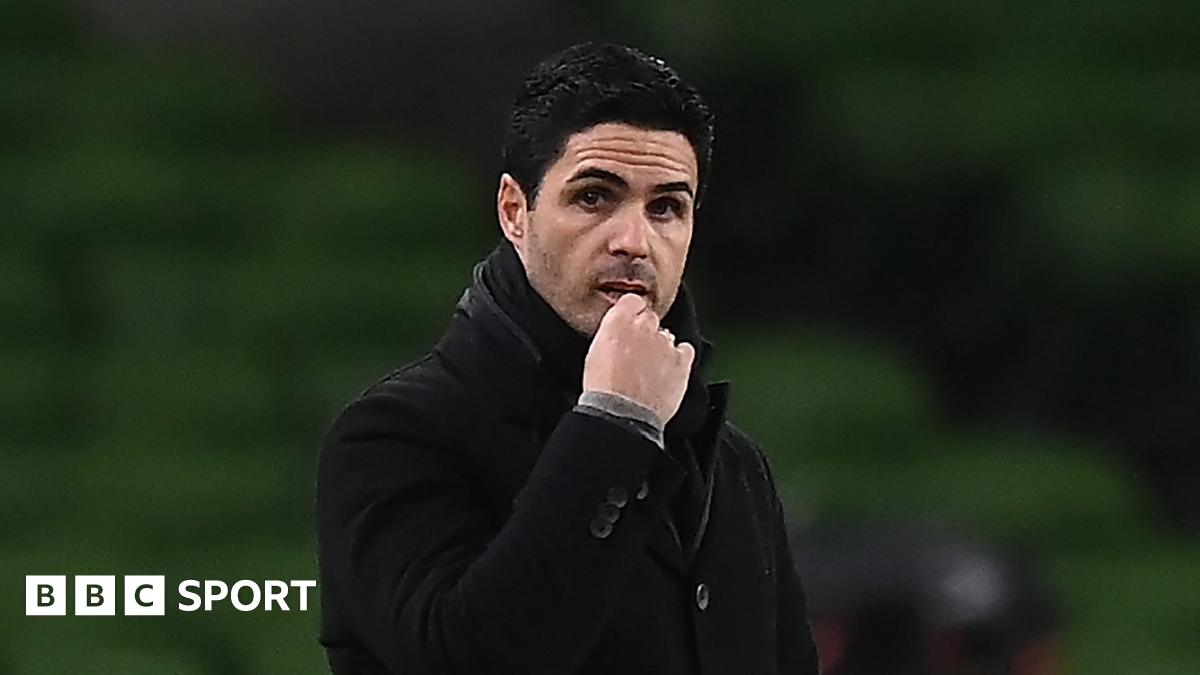
Arsenal are in talks about moving their Europa League ties with Benfica to a neutral venue because of coronavirus restrictions.

www.bbc.co.uk